
By Dan Hallett on July 31, 2020
Risk may be top of mind for many people these days – with public health, the economy, and financial markets challenged. Given my focus on due diligence, I think a lot about where risk lies in waiting, how to measure it, and how to communicate it to readers and clients.
If you are invested in an investment fund – i.e. mutual fund or ETF – you have likely seen a document called Fund Facts or ETF Facts. These are regulatory documents that summarize each fund’s key attributes. Perhaps the most controversial component of the documents is the risk rating, which was standardized a few years ago.
Risk is assessed in two steps. The fund’s sponsor first calculates each fund’s 10-year standard deviation (SD); a statistical measure of how wildly a fund’s monthly returns bounce around its average monthly return over the ten years. The SD figure is then annualized and mapped to a five-point risk scale ranging from “Low” to “High”. That risk label appears in each product’s Fund Facts or ETF Facts disclosure document. As far back as 2007 (when Fund Facts was first proposed) I was a vocal critic of this method because it doesn’t inform investors, in my view.
The idea of summarizing an investment in a digestible document is a great idea. But Fund Facts and ETF Facts have never lived up to their full potential when it comes to communicating risk. A few years ago, regulators codified a standard method to assess and label each fund’s risk. In my March 2016 letter to regulators I argued against their chosen hard-to-understand statistical calculation and arbitrary mapping to risk labels. Rather, I proposed a more intuitive approach – i.e. simply showing a fund’s past bear market losses.
I reasoned that investors would not be able to meaningfully translate arbitrary labels like “low”, “medium” and “high” into probable outcomes. I also feared that the preferred method would cause risk ratings to drop; which would then set investors up for a rude awakening when the next bear market arrived. A year later, in this January 2017 blog post, I confirmed that this was exactly what was happening.
Now that 2020 has served up the first bear market since the Financial Crisis, we have a real-time test of risk ratings found in Fund Facts and ETF Facts. Thank you to my friends at Fundata Canada Inc. for providing me with the raw data to see just how well the risk rating labels aligned with this year’s bear market losses. (Brian Bridger, Fundata’s Vice-President, Analytics & Data, also published a good article on this topic.)
The table below shows losses for the months of February and March 2020 combined; with highest, lowest, and average returns broken down by risk rating. The table also features – for each risk rating – a breakdown of funds by severity of losses.
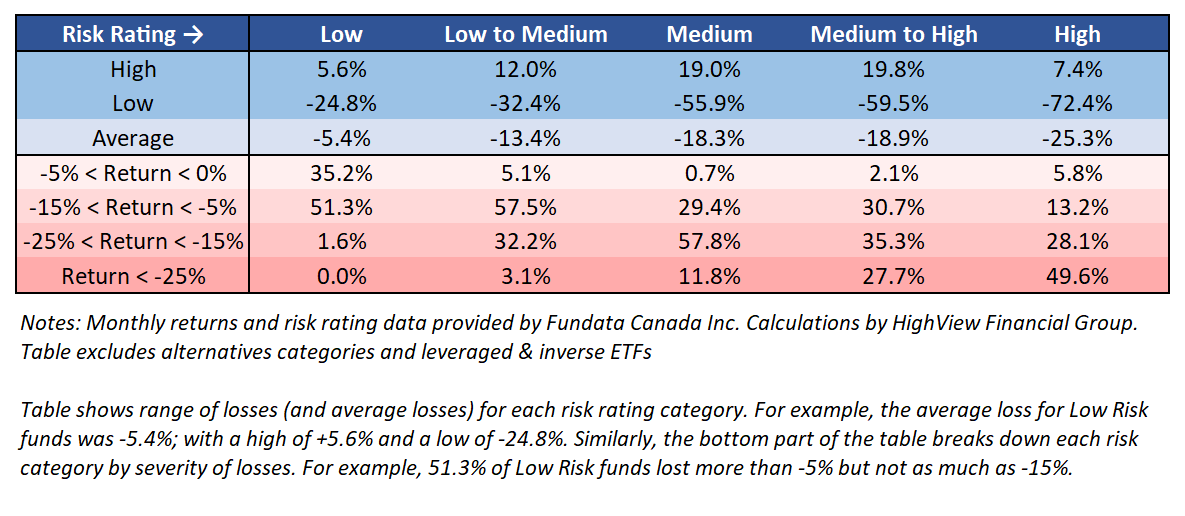
Risk can be complex and multi-faceted; which is why it’s problematic to use one measure to define and capture total potential risk. That’s also why you see such wide ranges and steep losses for funds in each risk rating category; even those that imply safety and stability. Most funds rated as “Low Risk” lost between -5% and -15% in two months. The loss of nearly -25% for a “Low Risk” fund jumps out of the table. I don’t know anyone who equates “low risk” with double-digit losses; let alone losing ¼ of an investment’s value.
Among the many “Low Risk” funds that lost -10% or more were high yield bond funds and balanced funds with plenty of stock market exposure. And the “Low Risk” fund with the dubious honour of losing -24.8% of its value? That is an income-oriented global balanced fund with more than 60% of its holdings in stocks; and fixed income focused on riskier high-yield bonds. Stocks have historically lost -30% to -50% every decade or so for the last 140 years. The mandatory risk rating methodology ignores what each fund holds (i.e. stocks or bonds); which is how you end up with heavy stock market exposure in the lowest risk categories.
The “Low to Medium Risk” category contains an awful lot of funds holding nothing but stocks; which is nonsensical. More than 35% of the 1,200 funds in this category lost more than 15 percent; of which 38% saw declines of more than 20 percent. Ouch!
While imperfect, I still believe that simply showing past bear market losses (and length of recoveries) better informs investors about risk. But all of this misses a larger point. The vast majority of investors build portfolios with multiple investment funds.
The purpose of an investment portfolio is to achieve its owner’s goals. And that can only be successfully achieved if a portfolio is a fit from a risk perspective. Providing piecemeal risk ratings by product leaves investors in the dark about the level of risk embedded at the total portfolio level. That’s why diligent advisors provide meaningful portfolio risk metrics – before asking clients to commit to a proposed portfolio.

- Do Covered Call Strategies Shine In “Flat Markets”? - June 26, 2025
- Piling into U.S. stocks? Don’t Expect the Past Decade to Repeat - January 15, 2025
- The S&P 500’s Three Surprising Traits - November 6, 2024

